:quality(50))
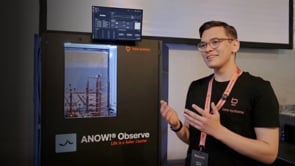
Using a rollercoaster equipped with multiple sensors, they demonstrate how telemetry data can be collected and made visible in real time. Infrared sensors track the movement of the rollercoaster car, while additional data provides insights into factors such as timing and motor speed. The resulting logs, metrics, and traces can then be displayed and analyzed in ANOW! Observe.
The demonstration illustrates how observability creates transparency across complex systems. By bringing telemetry data together in one place, ANOW! Observe helps IT teams understand system behavior, monitor performance, and identify potential issues more quickly.
The rollercoaster provides a tangible example of a much broader concept: wherever systems generate telemetry data, observability can turn that data into actionable insights.
Can you tell us about the Roller Coaster?
Basically, I want to build a showcase for ANOW! Observe, so our new observability solution. And to do it in a playful and interesting setting, we decided to basically build a rollercoaster and put some sensors on it. And with all these sensors, we can basically generate telemetry data, like log events, metrics, and traces to display or showcase ANOW! Observe, what it can do, and what it can be used for.
How did you build it?
So let's take a quick build rollercoaster, and then put many sensors on it, like infrared sensors to detect if some object is before it. And with all these sensors, we can measure the time between them, what the car has traveled, and then display it in ANOW! Observe. So in a panel to visualize it.
How does the Roller Coaster work with ANOW! Observe?
So what Magnus has actually already built is a system that you could basically monitor from the outside. He has, for example, multiple sensors that he already showed you. And this sensor basically emits data. It sends data. So what is a really good way for you to observe and see, for example, each sensor, how much the speed of the motor, all of this sort of critical data that you really need to observe? So this is another thing we did, for example, observability tool, that you could pretty simply see the live data immediately as you order a ride, for example. Once it passes the sensor, literally 100 milliseconds apart, you could see basically the data immediately inside ANOW! Observe. You would see it, and then you would see if there is any sort of problem. So this is how it is for ANOW! Observe. You could basically monitor everything that you'd like. And as a showcase that you could basically monitor any sort of system, rollercoaster is a really good candidate.
:quality(50))
:quality(50))