:quality(50))

Traditional observability platforms focus on infrastructure, applications, services, logs, metrics, and traces. All of which is valuable information, but it does not automatically explain why a batch job missed its SLA, which predecessor delayed a workflow, whether a failed task affected a business-critical process, or how workload automation data connects to the wider operational picture.
That gap is the reason why automation observability is emerging as a category of its own. Below is a practical review of 6 observability platforms to consider in 2026, with a special focus on the workload automation use case. Among them, ANOW! Observe stands apart as the only platform built from the ground up specifically for comprehensive automation observability rather than scheduler analytics, cloud monitoring, dashboarding, or log management.
What is automation observability?
Automation observability is the ability to understand, correlate, and act on telemetry from automated workflows, jobs, dependencies, infrastructure, applications, and operational events.
In workload automation, the core question is not only “Is the system healthy?” It is “Which automated process is affected, why is it delayed, what business service depends on it, and what should happen next?”
That requires more than technical dashboards. It requires automation context. This is especially important because automation landscapes are no longer simple. Enterprises run workloads across z/OS mainframes, distributed systems, cloud platforms, container environments, RPA tools, and sometimes multiple workload automation schedulers. Without a shared automation model, teams are left with monitoring islands, alert fatigue, manual investigation, and higher Mean Time to Resolution.
OpenTelemetry is becoming a key foundation for this shift. In the 2025 study “Taking Observability to the Next Level: OpenTelemetry’s Emerging Role in IT Performance and Reliability” by Enterprise Management Associates, 92% of respondents claimed to have positive expectations about the future impact of OpenTelemetry on their observability capabilities, thanks to the improved interoperability, integration, and scalability. Over 46% of users are already seeing more than 20% ROI for OpenTelemetry, and the main drivers are improved observability, cost savings, and reduced downtime and MTTR.
Explore the Future of Observability
Read the EMA analyst report to learn how OpenTelemetry is shaping the future of observability, driving operational efficiency, and fostering innovation in leading enterprises.
Observability platforms comparison: which one is the best fit for workload automation?
Platform | Best for | Standout features | |
|---|---|---|---|
Beta Systems ANOW! Observe | Automation Observability and unified control plane | OpenTelemetry-native automation context for jobs, workflows, logs, metrics, and dependencies | |
Broadcom Automation Analytics & Intelligence (AAI) | Automation analytics for automation platforms from the Broadcom portfolio | Broad scheduler coverage, SLA and critical path analysis | |
Grafana | Technical observability dashboards | Flexible visualization across metrics, logs, and traces | |
Datadog | Cloud-native full-stack observability | Broad infrastructure, application, cloud, Kubernetes, security, and APM coverage | |
BMC Control-M Workflow Insights | Control-M workflow visibility | Native Control-M workflow dashboards and analytics | |
Graylog | Log management | Strong centralized log search, parsing, alerting, and analysis |
1. Beta Systems ANOW! Observe: Best for automation observability
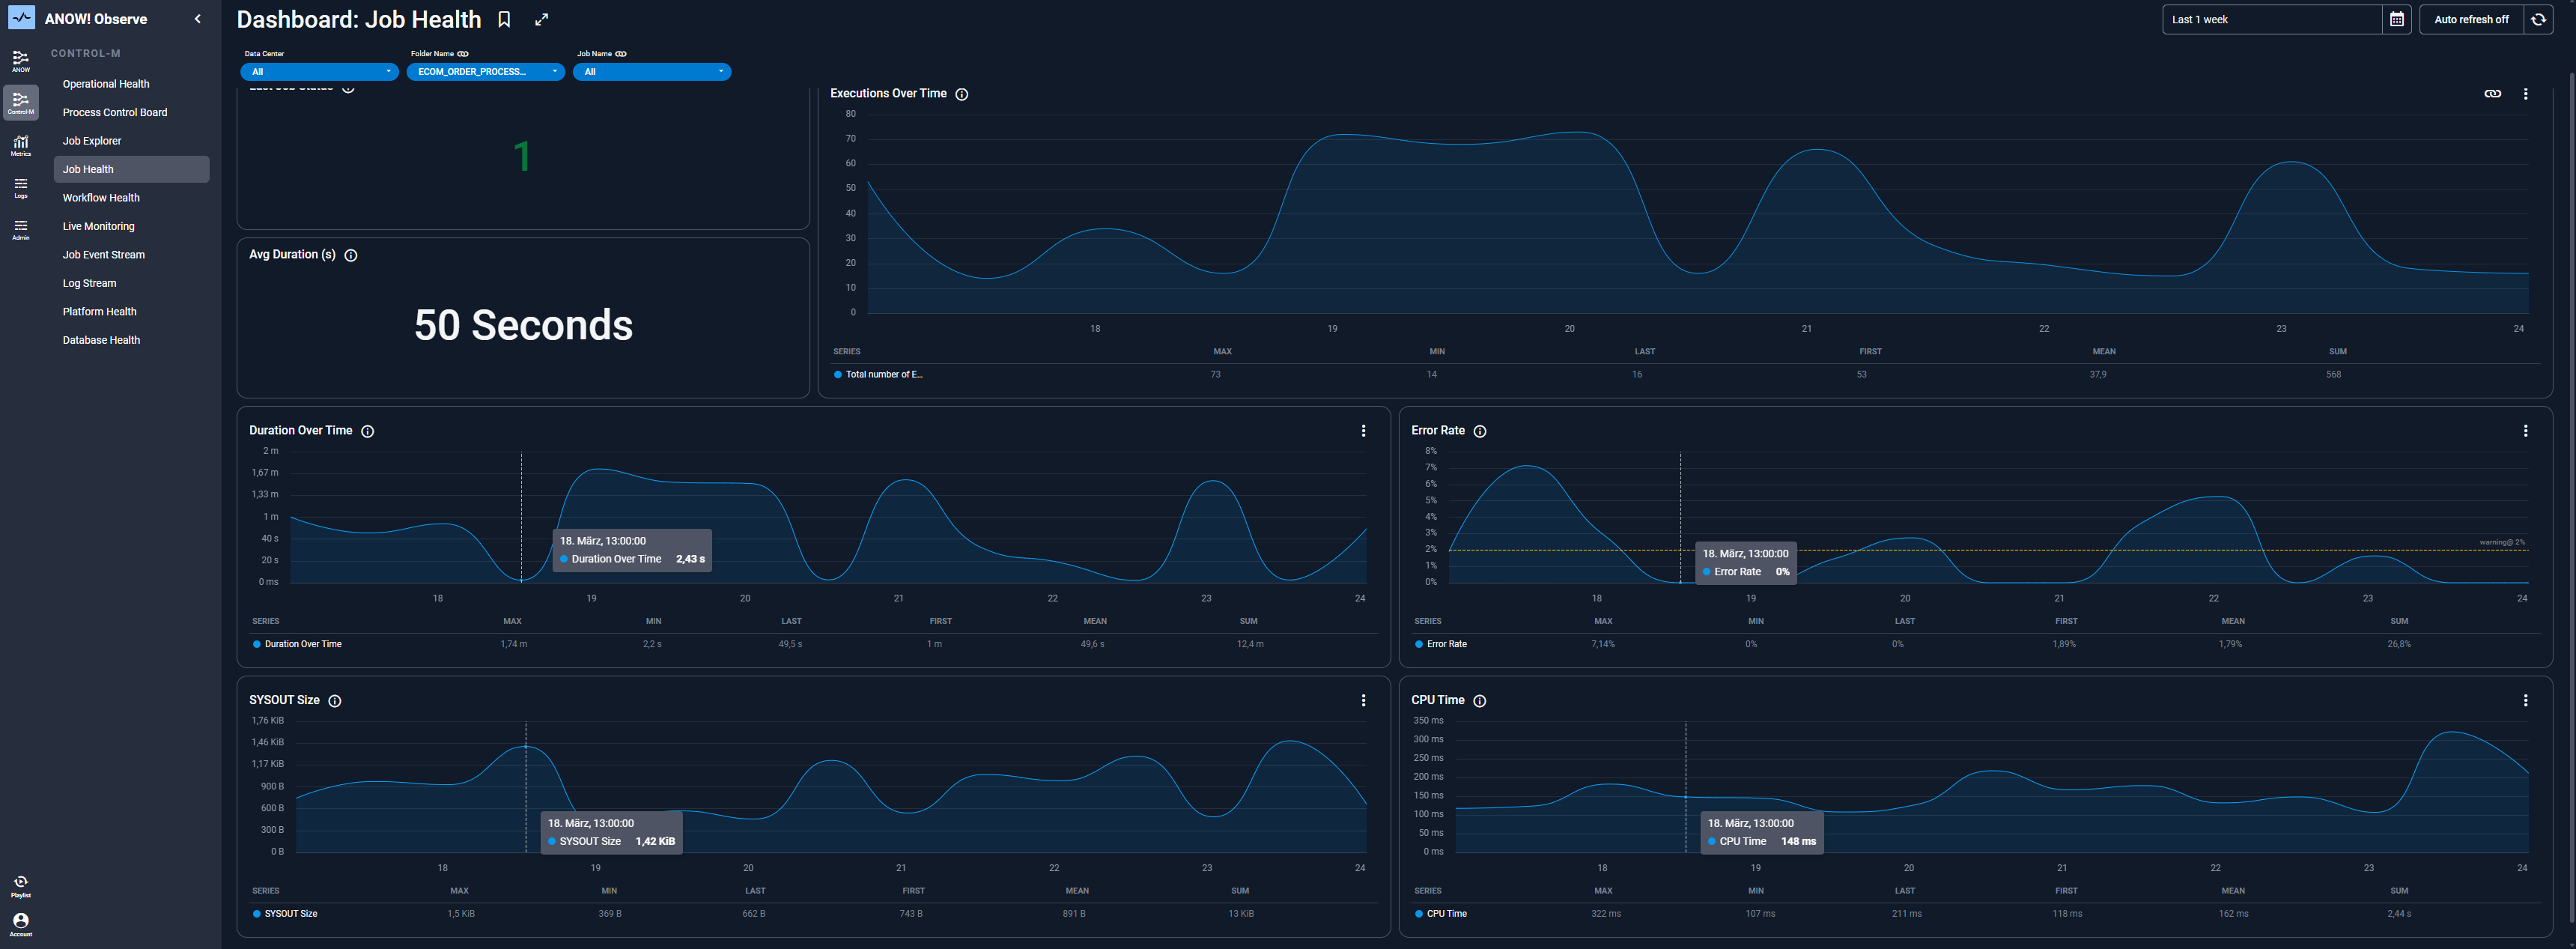
ANOW! Observe is a purpose-built observability platform and control plane for workload automation operations. It is designed for BMC Control-M and ANOW! Automate environments, turning job execution data into prioritized insights and automated remediation.
Unlike generic monitoring tools, ANOW! Observe is not just a dashboard layer on top of technical data. It is built around the logic of automation itself: jobs, workflows, task dependencies, execution context, SLAs, agents, logs, and operational events.
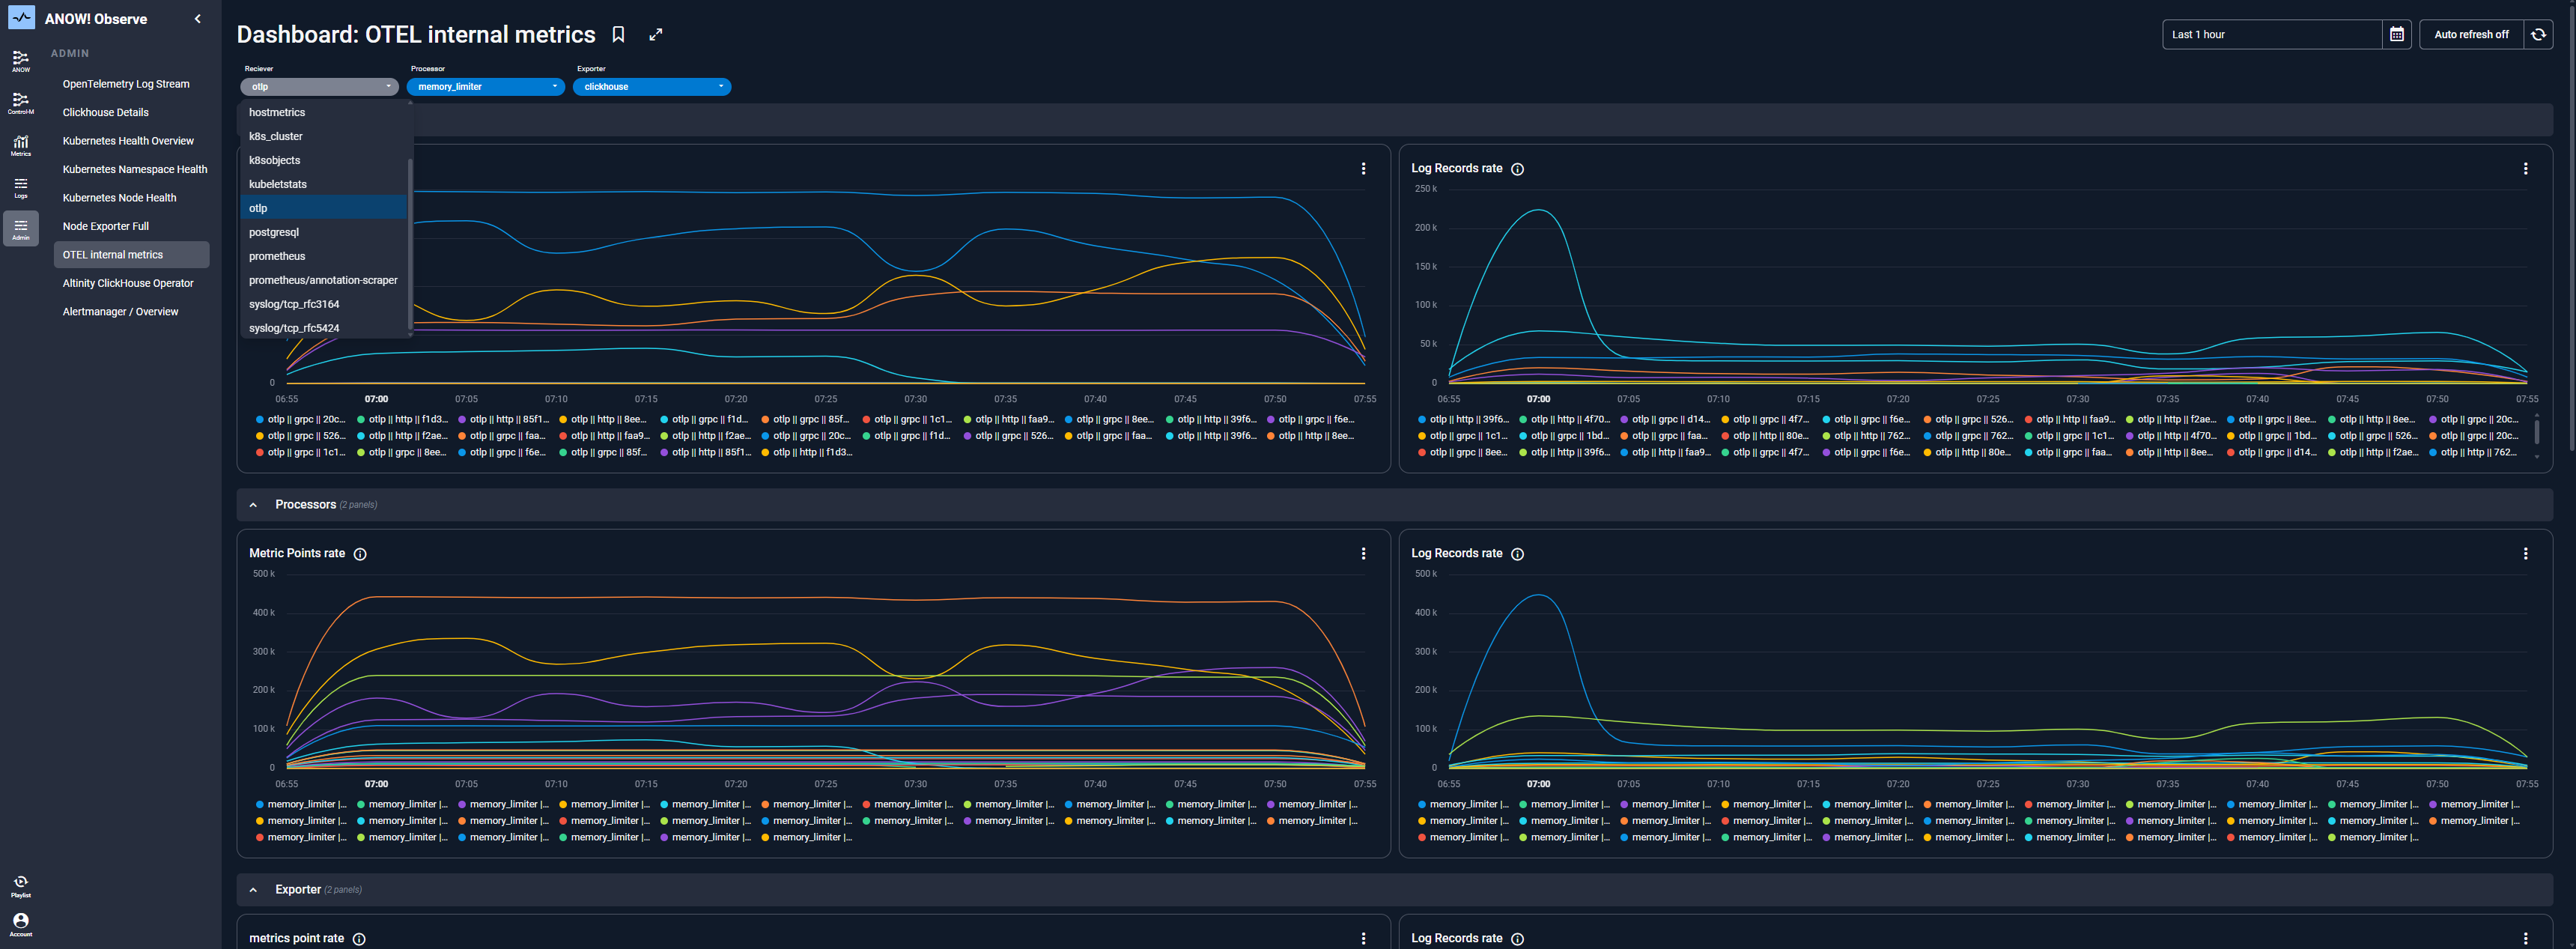
That makes it especially relevant for enterprises running critical workloads across heterogenous environments: mainframes, distributed systems, cloud platforms, and numerous business applications. ANOW! Observe creates a single pane of glass for workloads by using OpenTelemetry to collect, normalize, and unify telemetry across diverse sources.
Key features
Central job log and output intelligence: The platform centralizes job logs, outputs, job runs, dependencies, workflow execution states, and historical execution data.
OpenTelemetry foundation: The platform uses OpenTelemetry to standardize data collection and support interoperability across modern observability ecosystems.
Process and workflow analytics: Teams can track execution duration, success and failure rates, volumes, trends, SLA compliance, bottlenecks, anomalies, and historical workflow behavior.
Centralized audit-proof archive for WLA: ANOW! Observe aggregates logs from applications and infrastructure into a centralized repository tailored for workload automation environments, with search, analytics, retention policies, and secure, tamper-proof archiving.
Alerting, notification, and ITSM integration: The platform supports context-aware alerting and multi-channel notifications through Microsoft Teams, Slack, email, and integrations such as Jira, ServiceNow, and Zendesk.
Runbooks and automated remediation: ANOW! Observe supports closed-loop remediation patterns that can restart jobs, trigger workflows, create and assign tickets, document actions, and execute runbooks or webhooks.
Where ANOW! Observe shines
It is built from the ground up for automation observability. Many tools can collect logs, metrics, and traces. ANOW! Observe goes further by interpreting automation telemetry through workload automation concepts such as jobs, workflows, dependencies, and execution state.
It turns alerting into action. ANOW! Observe is built around the idea that observability should not stop at detection. With alert correlation, noise reduction, notifications, and governed remediation workflows, the platform helps teams shorten the path from signal to resolution.
It acts as an automation control plane. ANOW! Observe centralizes visibility across automation systems, connects events with decisions and actions, and enables orchestration of operational responses. That transforms observability from passive monitoring into active operations control.
Where ANOW! Observe may not fit
Teams looking only for generic infrastructure dashboards may prefer a broad technical observability platform if workload automation context is not a priority.
Organizations without significant workload automation complexity may not need the full value of automation-aware telemetry, workflow correlation, and audit-proof job log archiving.
Best fit
ANOW! Observe is the best fit for enterprises that need to understand and control automation at process level, not just system level.
The strongest fit is typically an organization with several of these conditions:
A complex enterprise automation landscape.
Many job failures, escalations, or delayed root-cause investigations.
SLA-driven operations where late detection creates business risk.
High event noise and limited end-to-end transparency.
A need for tamper-proof archiving, traceability, and audit readiness.
Critical industries, regulated operations, or strong compliance requirements.
ANOW! Observe is less likely to be the right starting point for teams looking only for open-source monitoring, infrastructure monitoring, or APM without broader workload automation observability needs.
What the customers say:
We will use ANOW! Observe as a central audit-proof archive to meet the regulatory requirements of BaFin and DORA. The number of systems and platforms in our landscape continues to grow, and with ANOW! Observe we are able to create a central platform that provides a holistic overview. This not only reduces switching between different interfaces but also enables the true single pane of glass.
- Marius Jansen, IT Specialist Workload Automation & Scheduling at LVM Versicherung
See Automation Observability in Action
Watch LVM’s success story to learn how enterprise automation can become a foundation for greater visibility and operational control.
2. Broadcom Automation Analytics & Intelligence: Best for legacy multi-scheduler WLA analytics
Broadcom Automation Analytics & Intelligence, commonly known as AAI, is a mature workload automation analytics platform. It is especially strong in organizations that need visibility across multiple schedulers and want to understand SLA risk, critical paths, and business process performance.
AAI’s strength is breadth. It supports a wide range of workload automation environments, including Automic, AutoSys, CA 7, Control-M, and Airflow. That makes it a useful option for enterprises with complex scheduler estates and a need for cross-vendor visibility.
Key features
Multi-scheduler workload automation visibility.
SLA, critical path management, and predictive analytics for early detection of SLA breach risks.
Business process visibility beyond individual jobs.
Where AAI shines
It is mature in workload automation analytics. AAI has a strong heritage in analyzing scheduler data and presenting cross-platform automation insight.
It helps teams manage SLA risk. Its critical path and predictive capabilities are useful when teams need to understand which delays may affect business commitments.
It supports broad WLA environments. For enterprises already standardized on Broadcom automation platforms or operating mixed scheduler estates, AAI can provide valuable operational visibility.
Where AAI falls short
AAI is primarily analytics- and reporting-driven rather than observability-native. It relies on traditional database and connector-based architecture, which can create additional operational overhead and dependence on the quality and availability of connected scheduler data.
It is also not OpenTelemetry-native, and it does not provide the same generic logs, metrics, traces, and automation-context model that a purpose-built automation observability platform offers.
Best fit
AAI is a strong fit for enterprises that need mature WLA analytics across multiple schedulers, particularly from the Broadcom portfolio, but it is not the right choice for teams looking for OpenTelemetry-native automation observability.
3. Grafana: Best for flexible technical observability dashboards
Grafana is one of the most widely used observability and visualization platforms. In the Grafana Stack, it is commonly used with Prometheus for metrics, Loki for logs, and Tempo for traces. It is highly flexible, vendor-neutral, OpenTelemetry-compatible, and widely adopted in cloud-native and Kubernetes environments.
Grafana is powerful when technical teams know exactly which data sources they want to visualize and how they want to model that data. It gives engineers a flexible canvas for dashboards, alerting, and operational analysis.
Key features
Flexible dashboards and visualization.
Strong metrics support through Prometheus, log analysis through Loki, and Trace analysis through Tempo.
OpenTelemetry compatibility.
Where Grafana shines
It is highly customizable. Teams can connect many data sources and build dashboards tailored to their exact operational needs.
It is strong in technical observability. Grafana works well for infrastructure metrics, application signals, Kubernetes data, logs, traces, and time-series analysis.
It has a large ecosystem. Its open and modular approach makes it attractive for engineering teams that want flexibility and control.
Where Grafana falls short
Grafana does not natively understand workload automation semantics. It can visualize automation-related data if teams feed it the right telemetry, but it does not automatically know what a job, workflow, dependency, predecessor, SLA, agent, or automation execution model means.
That means correlation must often be built manually. Teams need to design data models, normalize inputs, create dashboards, and maintain automation context themselves. For large enterprise automation environments, that can create complexity and fragmentation.
Best fit
Grafana is a good fit for platform engineering, DevOps, and SRE teams that need flexible observability dashboards and have the skills to model their own data.
It is not the best fit when the primary need is out-of-the-box automation observability with job, workflow, dependency, SLA, and execution context already built in.
4. Datadog: Best for cloud-native full-stack observability
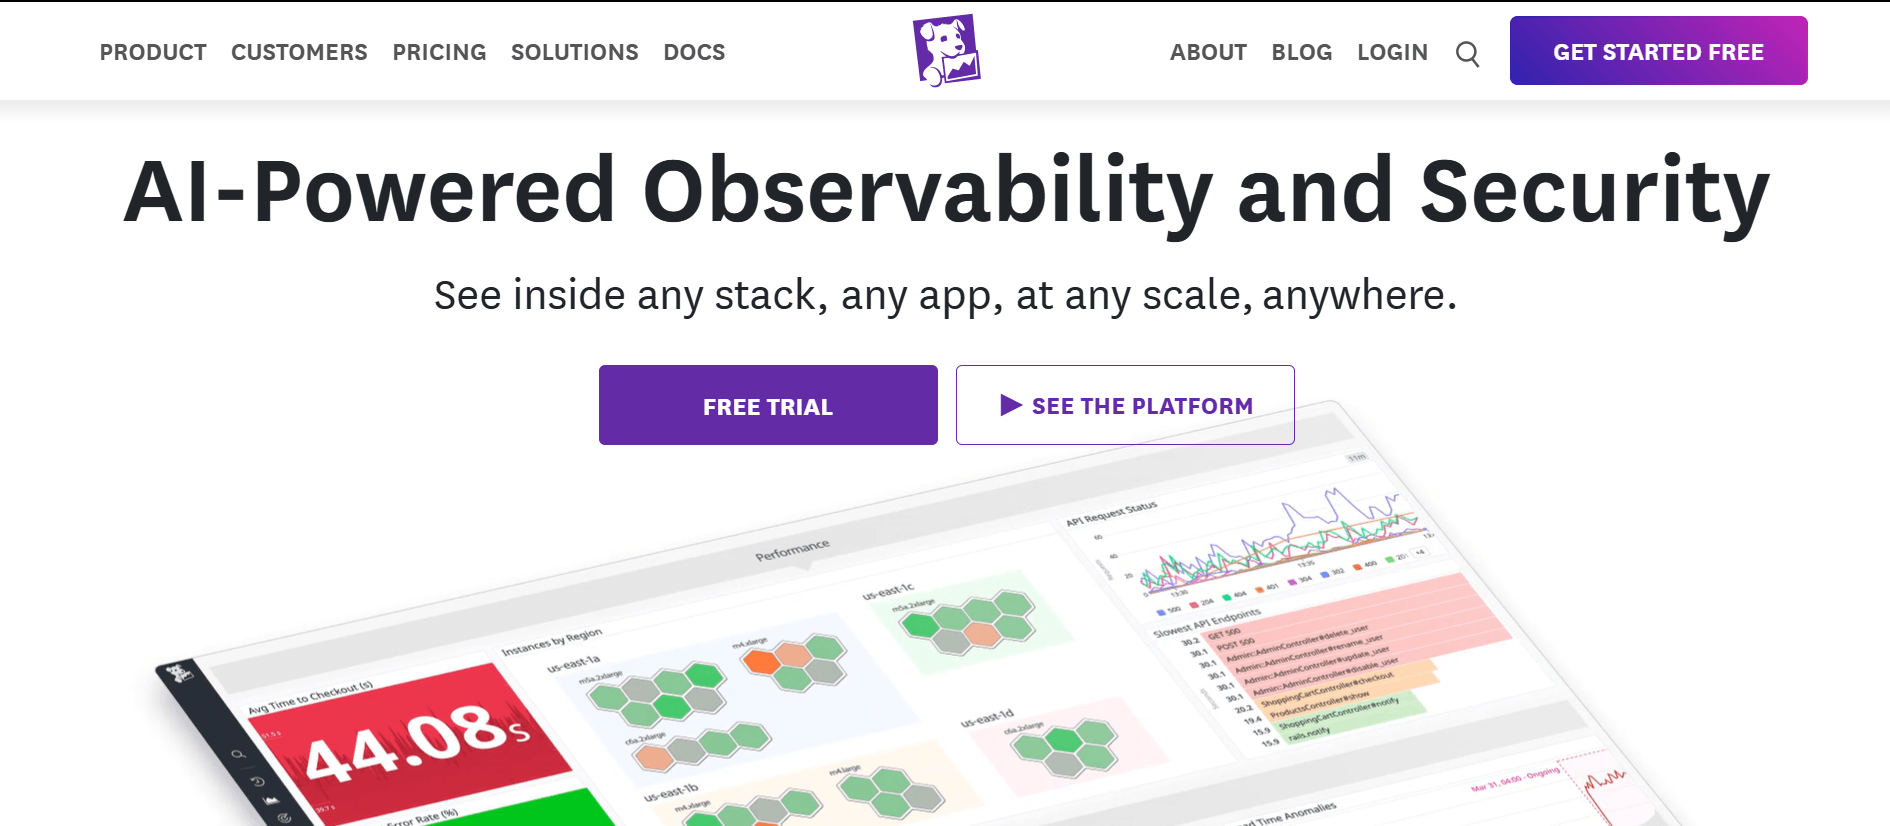
Datadog is a broad cloud-native observability platform covering infrastructure and cloud monitoring, application performance monitoring, logs, security, CI/CD visibility, and Kubernetes environments. It is known for fast deployment, agent-based data collection, extensive integrations, and real-time operational dashboards.
Key features
Logs, metrics, traces, APM, infrastructure monitoring, security, CI/CD, and RUM.
Real-time dashboards and alerting.
OpenTelemetry compatibility.
Where Datadog shines
It covers modern environments broadly. Datadog is strong for organizations with dynamic cloud, Kubernetes, microservices, and application environments.
It is fast to implement. Agent-based deployment and prebuilt integrations help teams start collecting operational data quickly.
It unifies many observability use cases. For infrastructure, application, cloud, security, and DevOps teams, Datadog provides broad coverage in one platform.
Where Datadog falls short
Datadog is not built around workload automation. It does not provide a native semantic model for batch processes, jobs, workflow dependencies, scheduler execution, or SLA-based automation logic.
Correlation is based on telemetry signals rather than automation process logic. That means Datadog can show that an infrastructure issue happened, but it may not explain which automation workflow was affected, which predecessor caused the delay, or how a failed batch process impacts the business timeline.
→ Compare infrastructure automation tools for broader automation needs.
Best fit
Datadog is a strong fit for cloud-native engineering teams that need broad full-stack observability for applications, infrastructure, cloud services, and Kubernetes.
It is less ideal when the core requirement is workload automation observability with built-in job, workflow, dependency, and SLA context.
Pro Tip
If your team gets too many alerts but still misses the incidents that matter, the problem is not monitoring coverage. It is lack of automation context. ANOW! Observe helps correlate job events, prioritize issues, and reduce noise before teams waste time on manual triage.
5. BMC Control-M Workflow Insights: Best for Control-M workflow visibility
BMC Control-M Workflow Insights provides visibility into Control-M workflows, job behavior, trends, alerts, SLA services, and optimization opportunities.
Its biggest advantage is native Control-M depth. It uses real workflow execution data and provides predefined dashboards for workflow health, SLA performance, trends, alerts, and continuous improvement.
Key features
Deep native integration with Control-M.
Early detection of performance drift and anomalies.
Near real-time visibility into workflow behavior.
Scalable search and analytics foundation using OpenSearch / Elasticsearch.
Where Control-M Workflow Insights shines
It is strong inside Control-M. Teams using Control-M heavily can benefit from workflow-specific insight without needing to build dashboards from scratch.
Where Control-M Workflow Insights falls short
The main limitation is scope. Control-M Workflow Insights does not provide a cross-platform automation observability approach.
It is also primarily analytics- and dashboard-driven rather than observability-native. It does not provide a unified OpenTelemetry-native telemetry model across systems, nor does it combine automation context with broad logs, metrics, and traces for deeper technical root-cause analysis.
In addition, it may require additional infrastructure such as OpenSearch, Kafka, and Zookeeper, which can increase CPU, memory, storage, and operational requirements.
Best fit
Control-M Workflow Insights is best for organizations that are committed to Control-M and need workflow analytics, SLA dashboards, and performance insights within that environment.
It is not suitable for enterprises that want cross-tool automation observability, OpenTelemetry-native data collection, or a unified telemetry model that spans workload automation, infrastructure, applications, and hybrid IT.
6. Graylog: Best for centralized log management
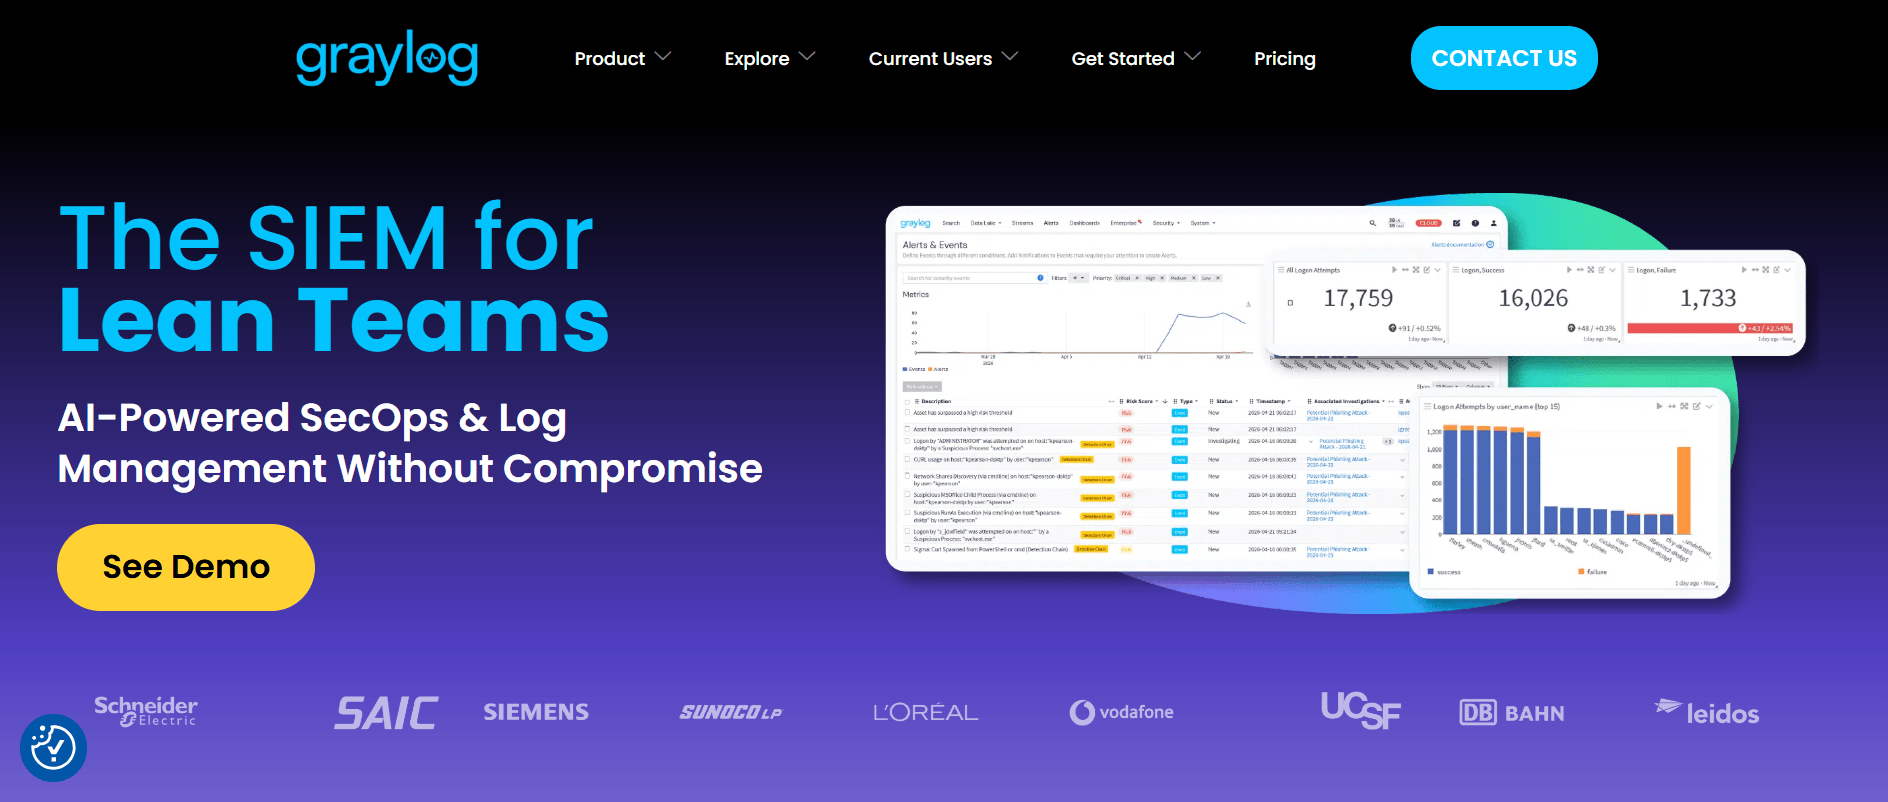
Graylog is a logs-first platform for centralized log management, search, parsing, pipelines, alerting, and security or IT operations analysis. It is often easier to set up than large ELK-style environments and can be a practical option for teams that need to collect, structure, and analyze logs from many sources.
Key features
Centralized log collection and analysis.
Powerful search and filtering.
Structured log processing through parsing and pipelines.
Alerting and event features.
Open-source core with enterprise extensions.
Integration with many data sources.
Where Graylog shines
It is strong for logs. Graylog is a practical choice for teams that need to centralize log data and search it efficiently.
It supports structured processing. Pipelines and parsing help teams normalize logs for analysis and alerting.
Where Graylog falls short
Graylog is not a holistic automation observability platform. It focuses heavily on logs, with limited or no native support for metrics and traces compared with full observability platforms.
Best fit
Graylog is best for teams that need strong log management and event analysis.
It is not the best fit when the goal is end-to-end automation observability with workload automation context, dependency mapping, workflow correlation, and OpenTelemetry-native telemetry.
Automate with confidence using ANOW! Observe
Workload automation has become too important to monitor with tools that do not understand automation.
Generic observability platforms are strong at infrastructure, applications, services, and cloud-native telemetry. WLA analytics tools are strong at scheduler reporting and SLA forecasting. Log platforms are strong at collecting operational records.
But automation observability requires something more: a model that understands how automation runs.
ANOW! Observe is built for that purpose. It brings together workload automation context, OpenTelemetry-native telemetry, real-time process monitoring, process analytics, noise reduction, audit-proof log archiving, and automated remediation in one platform for hybrid enterprise automation.
See ANOW! Observe in Action
Book a demo to discover how ANOW! Observe helps reduce alert noise, improve workflow visibility, and automate operational response
:quality(50))
:quality(50))
:quality(50))